Queens Rental Market DSCR Math: The 4.4% Rent Jump Actually Matters
Key Takeaways
- Queens rents rose 4.4% year-over-year — median asking rent now above $2,800/month
- A 4.4% rent increase moves Lender DSCR by approximately 0.06–0.09 points depending on LTV
- Flushing, Jackson Heights, and Jamaica are showing the strongest rent growth — ahead of the borough average
- DSCR lenders underwrite on actual current leases — rent growth only helps when leases are renewed
- Queens vacancy is under 2% — effectively full occupancy borough-wide
- The rent tailwind is real but does not offset insurance and property tax compression on its own
Table of Contents
- Queens DSCR Math: What the 4.4% Growth Number Actually Shows
- How Queens Rent Growth Actually Moves the DSCR Formula
- The Math: A Composite Queens 4-Unit at Current Market
- Queens Submarket Variation: Where 4.4% Is the Average, Not the Floor
- Sunnyside and Astoria: Above-Average Growth, Different Bases
- Long Island City: High Base, Slower Growth
- Queens DSCR Math: The Structural Advantage Over Brooklyn
- When Queens Rent Growth Does Not Flow Through to Qualifying DSCR
- What Queens DSCR Math Means for Investors Evaluating Deals Now
- Frequently Asked Questions
- How does Queens rent growth directly affect DSCR underwriting on a 4-unit?
- Are Queens 4-unit DSCR deals available at competitive terms in 2026?
- How much does Queens rent growth benefit a marginal DSCR deal vs a strong one?
- Bottom Line — Queens DSCR Math on the 4.4% Rent Jump
Queens DSCR Math starts with a number that actually matters: rents up 4.4% year over year is not just a headline — it is a specific DSCR improvement that changes deal math in quantifiable ways. The rent covers more of the PITIA. The stressed ratio moves. Deals that were marginal at 2025 rents may now clear the BKDSCR 1.25 single-stress standard at current rents. This post runs the actual math on a composite Queens 4-unit — same property, same loan, before and after the 4.4% rent growth.
| MARKET SNAPSHOT — Queens Rental Market, May 2026 | |
|---|---|
| Sources: BKDSCR Research | |
| Queens YoY Rent Growth (Chandan Economics / Zillow ZORI, data through Feb 2026): | |
| Queens borough | +4.4% year-over-year | +0.1% month-over-month |
| NYC metro overall | +4.2% YoY (2.3x the national 1.8% rate) |
| Manhattan | +6.0% YoY | Brooklyn: +5.6% YoY |
| Staten Island | +3.1% YoY | Bronx: +1.7% YoY |
| NYC 3-mo annualized | +2.4% vs +0.8% nationally |
| Queens Submarket Rents (RentCafe/Yardi Matrix, April 2026): | |
| Long Island City avg | $4,764 (+3.58% YoY) | Astoria avg: $3,390 (+5.58% YoY) | Sunnyside avg: $2,341 (+6.55% YoY) |
| DSCR Rates (May 2026 per Griffin Funding): | |
| Well-qualified borrowers | 6.0%–7.5% (30yr fixed) | Queens 4-unit benchmark: 7.25% at 75% LTV, 720+ FICO |
Start with the Deal Filter — property type, rent roll, unit count, and PITIA in 60 seconds.
Queens DSCR Math: What the 4.4% Growth Number Actually Shows
The 4.4% Queens rent growth figure tracks the Zillow Observed Rent Index (ZORI) through February 2026. ZORI measures seasonally adjusted rents across listed and recently leased units, providing a more current and accurate picture of market-rate rent movement than lagging survey-based data.
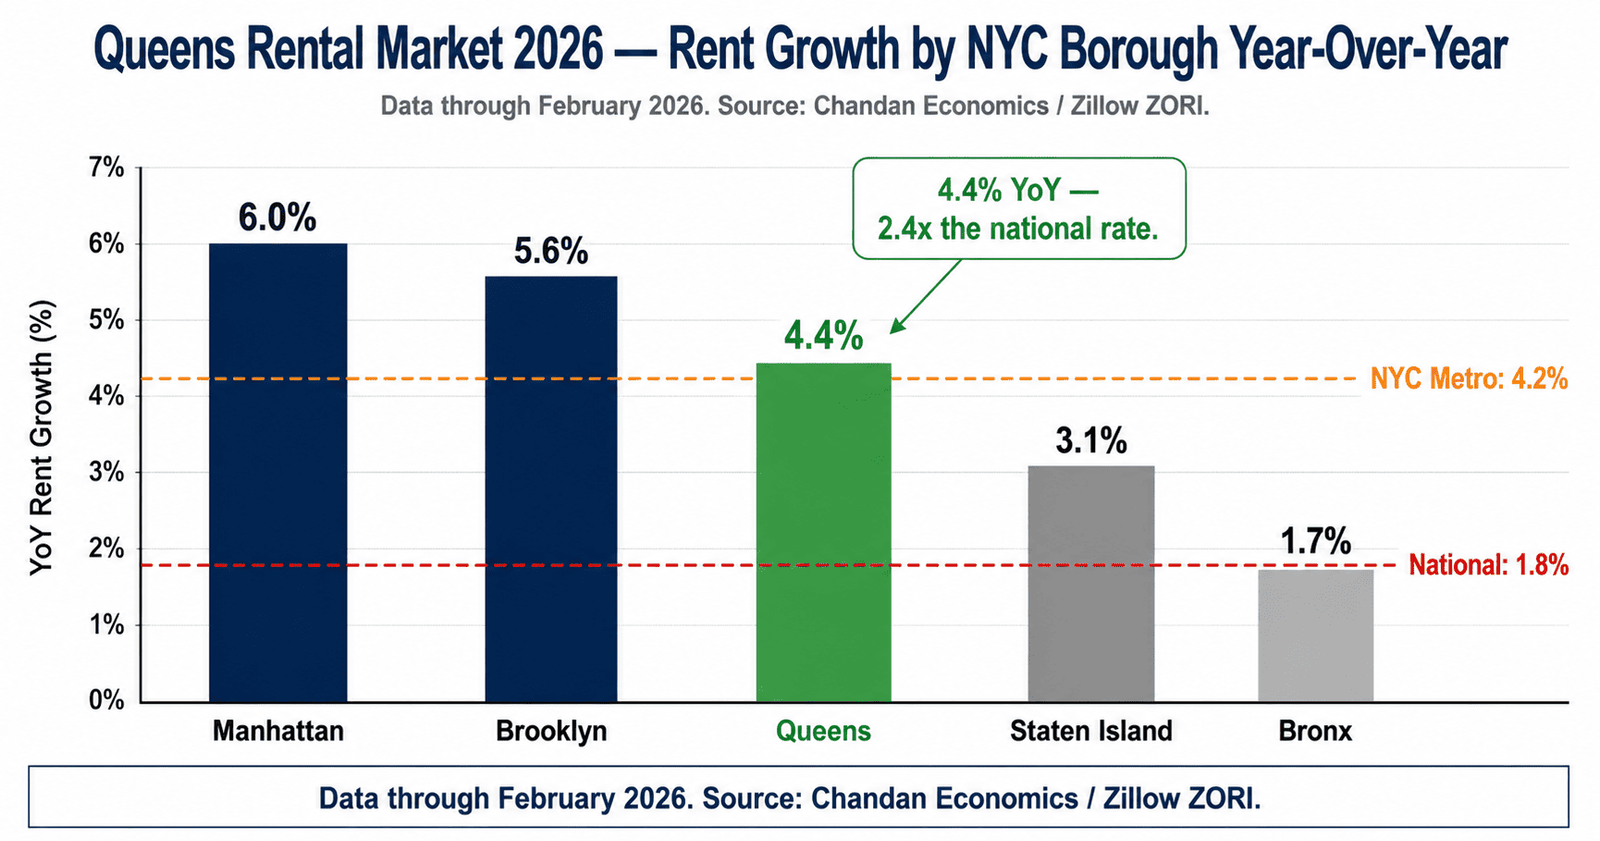
- NYC metro area: +4.2% year-over-year — more than double the 1.8% national average. The spread reflects a NYC market absorbing demand from constrained supply, sustained immigration, and high barriers to homeownership.
- Queens at 4.4%: Third among boroughs. Manhattan led at 6.0%, Brooklyn followed at 5.6%, with Queens, Staten Island (3.1%), and the Bronx (1.7%) trailing.
- Short-term momentum: Queens posted +0.1% month-over-month in the February data. Brooklyn led at +0.4% MoM, Manhattan at +0.3%.
- Three-month annualized: NYC stands at +2.4% annualized on a three-month moving average basis, versus +0.8% nationally.
The 4.4% figure is a borough-wide average. The MNS Queens Rental Market Report tracked year-over-year growth at +6.74% for studios, +5.30% for one-bedroom units, and +4.00% for two-bedroom units, for an overall blended increase of +5.17%. For DSCR investors, the relevant data point is what the appraiser’s 1007 rent schedule will show for a specific Queens submarket and unit configuration.
How Queens Rent Growth Actually Moves the DSCR Formula
DSCR is gross monthly rent divided by monthly PITIA. Rent growth affects only the numerator — but in a direct, calculable way. On a stabilized Queens 4-unit where all four units capture the borough-average 4.4% rent increase, the change in qualifying DSCR is arithmetic. The PITIA stays fixed. The rent goes up. The ratio improves. See also: rent freeze DSCR impact.
The Math: A Composite Queens 4-Unit at Current Market
The following composite deal uses a Queens outer-borough 4-unit in the Woodhaven/Ridgewood/Jackson Heights submarket. Queens Class 1 and lower Class 2 properties carry significantly lower property tax burdens than equivalent Brooklyn Class 2 buildings — one of the structural DSCR advantages of the Queens market. See also: Brooklyn rent DSCR math.
| DEAL INPUT | FIGURE |
|---|---|
| Property Type | 4-unit walkup, Queens outer-borough |
| Purchase Price | $950,000 |
| Down Payment (25%) | $237,500 |
| Loan Amount | $712,500 |
| Rate / Term | 7.25% / 30-year fixed |
| Monthly P&I | $4,865 |
| Monthly Taxes | $950 (Queens Class 2, lower than Brooklyn) |
| Monthly Insurance | $480 |
| Total PITIA | $6,295/month |
On this PITIA structure, the 4.4% rent growth produces the following DSCR outcomes:
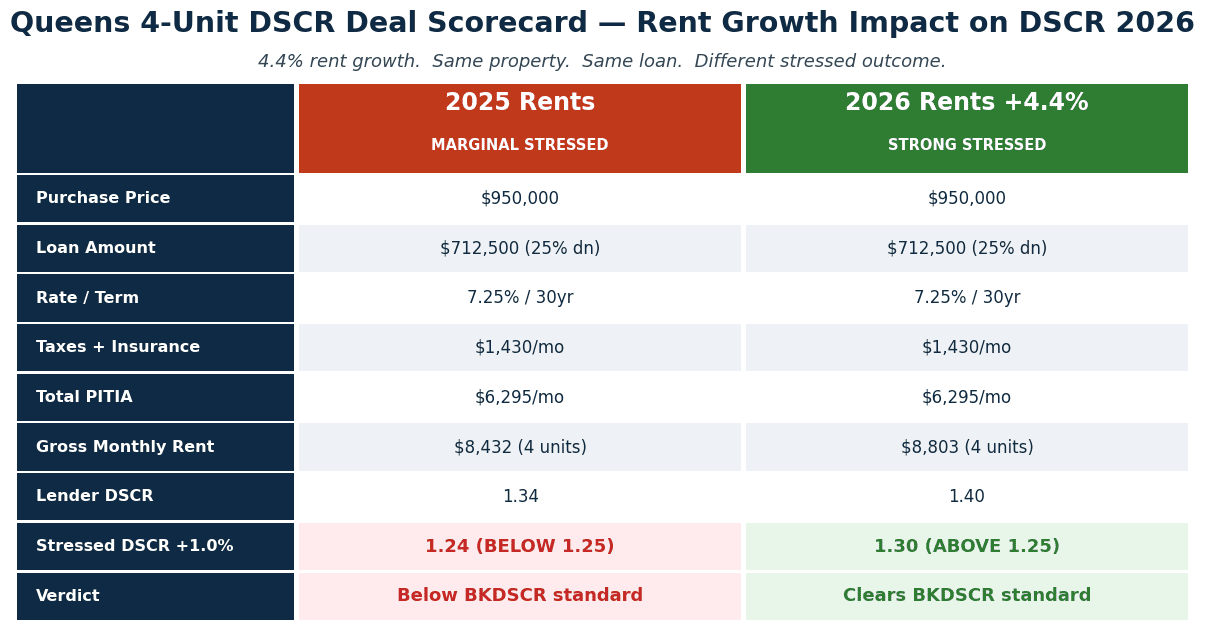
| 2025 Rents | 2026 Rents (+4.4%) | |
|---|---|---|
| Avg rent / unit | $2,108 | $2,201 |
| Gross monthly rent | $8,432 | $8,803 |
| Monthly PITIA | $6,295 | $6,295 |
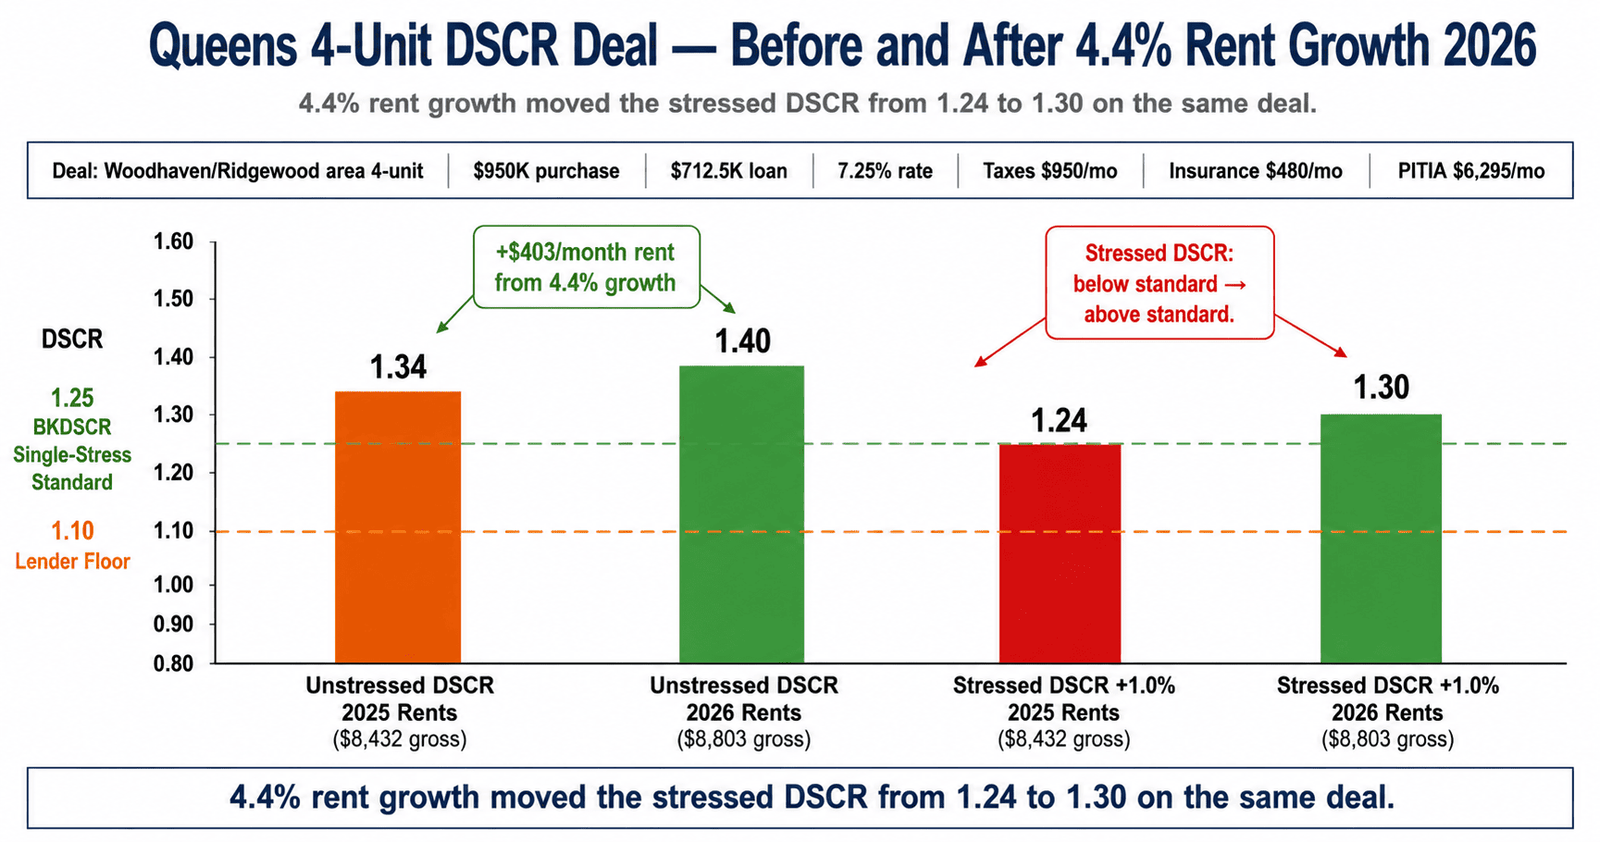
| Lender DSCR | 1.34 | 1.40 |
| Stressed DSCR (+1.0%) | 1.24 — BELOW 1.25 std | 1.30 — ABOVE 1.25 std |
The $403 monthly rent increase from 4.4% growth adds 0.06 to the lender DSCR — from 1.34 to 1.40. The more consequential impact shows in the stressed DSCR. At 2025 rents, the deal stresses to 1.24 — just below the BKDSCR 1.25 single-stress standard. At 2026 rents, the same deal stresses to 1.30 — above the standard. The 4.4% rent growth changed the deal’s risk classification from “marginal on stress” to “clean pass on stress.” That changes lender access, rate tier, and reserve requirements.
Queens Submarket Variation: Where 4.4% Is the Average, Not the Floor
The 4.4% borough-wide figure is an average across all Queens rental stock. Submarket performance varies significantly, and investors selecting Queens deals based on DSCR underwriting need to understand what the comp pool in the specific submarket is producing.
Sunnyside and Astoria: Above-Average Growth, Different Bases
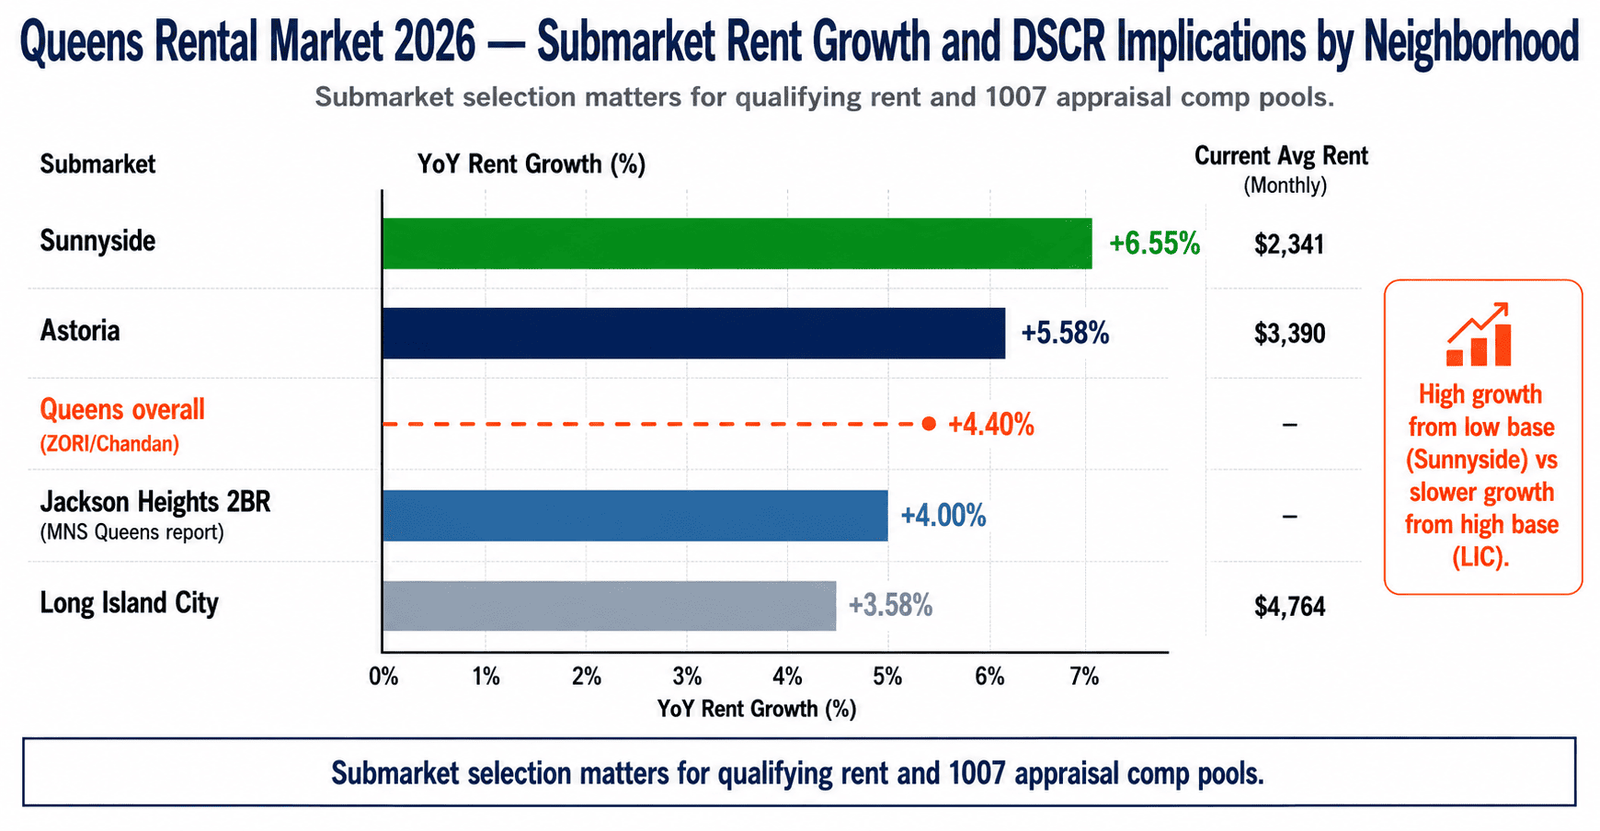
Sunnyside led Queens neighborhoods in year-over-year rent growth at +6.55%, with the average apartment rent moving from $2,197 to $2,341. Strong transit access (7 train) and a tenant base that includes young professionals priced out of western Queens premium neighborhoods drives this market. For a DSCR investor, Sunnyside’s growth rate means the 1007 appraisal comp pool is likely to confirm current market rents. Astoria posted +5.58% year-over-year rent growth, with average rents at $3,390.
The higher starting rent base in Astoria means the 4.4% growth translates to more absolute dollars per unit — $190/month per unit on a $3,390 starting rent vs $144 in Sunnyside.
Long Island City: High Base, Slower Growth
Long Island City posted the slowest Queens rent growth at +3.58%, but from a starting base of $4,764 — well above the borough average. The LIC 1007 comp pool will likely show strong absolute rent support, but investors need to confirm that their specific unit configuration matches the appraiser’s comp set. LIC’s luxury stock can produce comps that do not apply to a pre-war walkup unit.
Jackson Heights, Ridgewood, and Woodhaven represent the workhorse Queens investor market — the neighborhoods where 4-unit properties are priced in the $850,000 to $1,100,000 range. These are the deals where the DSCR math is tightest and where 4.4% rent growth has the most meaningful proportional impact on qualification. The cash flow models the full return picture — beyond DSCR — for any Queens deal including operating expenses, vacancy, and capital reserve assumptions.
Queens DSCR Math: The Structural Advantage Over Brooklyn
The Queens rental market DSCR advantage in 2026 is not only the rent growth rate — it is the cost structure on the denominator side. Queens property taxes are structurally lower than Brooklyn’s for equivalent residential investment properties. A Queens Class 2 building or well-assessed Class 1 typically carries monthly taxes of $800 to $1,200, versus $1,200 to $1,800 for a comparable Brooklyn Class 2. The difference is $300 to $600 per month in PITIA without any change in loan structure or insurance. Queens is improving both the numerator (4.4% rent growth) and the denominator (lower taxes) simultaneously in 2026.
The NYC Department of Finance released its 2026–27 tax assessment data this spring. Class 2 assessments rose 6.9% citywide, with Queens Class 2 properties seeing increases in the 5–8% range. For DSCR investors evaluating a Queens deal in 2026, confirming the current tax assessment — not the 2024 or 2025 figure — matters for accurate PITIA modeling. The deal killers page covers the most common ways insurance and tax inputs produce DSCR surprises at underwriting.
Get the DSCR Playbook — every input, threshold, and deal-killer for NYC outer-borough investors in one place.
When Queens Rent Growth Does Not Flow Through to Qualifying DSCR
- Rent-stabilized buildings: The NYC RGB adopted a 3% allowable increase for one-year leases for October 2025–September 2026. For stabilized units, the allowable increase is 3%, not 4.4%. Investors who model qualifying DSCR using the market-rate growth figure on a building that is partially or fully stabilized are overstating the rent improvement.
- 1007 appraisal comp lag: The appraiser’s 1007 rent schedule is based on comparable leases, not current asking rents. In a market where rents rose 4.4% year over year, comparables from 6–12 months ago reflect last year’s level. Investors who go to contract on current asking rent estimates without confirming the appraisal comp pool may see a 1007 that comes in below their model.
- Above-market existing leases: A property with existing leases above the appraiser’s market rent estimate gets penalized in DSCR underwriting. Lenders use the lower of in-place rent or appraised market rent. A Queens investor with tenants paying $2,400 may find the 1007 showing a market rent of $2,300 — and the lender using $2,300, not $2,400.
What Queens DSCR Math Means for Investors Evaluating Deals Now
The 4.4% Queens rent growth data creates a specific window for DSCR investors in 2026. Deals that were marginal on stress test at 2025 rents — like the composite deal above, which stressed to 1.24 at 2025 rents — may now clear both the lender floor and the BKDSCR 1.25 stressed standard at current rents. That is not a reason to buy a deal that doesn’t work structurally. It is a reason to re-run the numbers on Queens deals you modeled 6–12 months ago and may have passed on because the stressed DSCR was thin.
For investors actively evaluating Queens 4-units in 2026, three specific analytical adjustments are warranted. First, use current market rents for the submarket and unit configuration, confirmed by active listing data in the prior 30–60 days. Second, build in the 6.9% tax assessment increase for 2026–27 rather than using the prior-year tax figure. Third, run the +1.0% stressed DSCR before going to contract, not after.
Per Chandan Economics, Queens small multifamily saw strong transaction volume in 2024, which produces a reasonable comp pool in most submarkets. Investors who confirm the appraiser’s likely comp methodology in the specific Queens submarket before contracting are the investors who avoid the appraisal gap problem at underwriting.
Frequently Asked Questions
How does Queens rent growth directly affect DSCR underwriting on a 4-unit?
DSCR is gross rent divided by PITIA. The PITIA is fixed at the time of application. Rent growth improves the numerator. On a Queens 4-unit where all four units capture the 4.4% YoY growth, the total gross rent for DSCR qualifying purposes increases by approximately 4.4%, assuming the appraiser’s 1007 rent schedule reflects current market. On the composite deal in this post, that is +$403/month, which adds 0.06 to the lender DSCR and 0.06 to the stressed DSCR. The stressed DSCR movement is the one that matters most for lender access and rate tier.
Are Queens 4-unit DSCR deals available at competitive terms in 2026?
Yes. DSCR rates for well-qualified borrowers on Queens 4-unit deals in May 2026 are ranging from 6.0% to 7.5% per Griffin Funding’s published rate range. The structural advantage of Queens in this environment is the combination of rent growth on the income side and lower property taxes on the cost side relative to Brooklyn comparable deals. For current DSCR rate details, see current DSCR loan rates.
How much does Queens rent growth benefit a marginal DSCR deal vs a strong one?
The benefit is proportionally larger on marginal deals — those sitting between 1.10 and 1.25 — than on strong deals at 1.35+. A 4.4% rent increase on a deal at 1.10 DSCR adds approximately 0.05 to 0.07 to the ratio, potentially moving it from below a lender overlay to above it. Investors who identified Queens deals that were borderline at 2025 rents may find those same deals now clear the stressed standard they previously could not reach.
Bottom Line — Queens DSCR Math on the 4.4% Rent Jump
Queens rents up 4.4% year over year is not just a headline. It is a specific DSCR improvement that changes deal math in quantifiable ways. On the composite Queens 4-unit analyzed here, 4.4% rent growth added $403/month to qualifying gross rent, moved the lender DSCR from 1.34 to 1.40, and moved the stressed DSCR from 1.24 to 1.30 — from below the BKDSCR single-stress standard to above it. That shift changes which lenders the deal can go to, at what rate tier, and with what reserve requirements.
The same property, the same loan, the same PITIA: different qualified outcome because the numerator moved with the market.
The caveats are real: stabilized units capture 3%, not 4.4%; the 1007 appraisal comp pool may lag current asking rents by a quarter or two; and the 6.9% citywide tax assessment increase for 2026–27 adds to PITIA in the other direction. The investor who accounts for all three variables — and runs the stressed DSCR before contracting rather than after — is the investor positioned to act on the Queens rental market DSCR 2026 opportunity with precision.
Run a Deal Review — current DSCR, stressed DSCR, NOI, and updated tax assessment modeled at current inputs, delivered within 48–72 hours.